25 Oct On ice: When research happens at 12,000 feet
UND faculty-led ascent to Continental Glacier offers hands-on research experience for students

A summer week at the Continental Glacier, some 12,000 feet in elevation, afforded an opportunity to study both the ice and water in the area. From left: Lance DiAngelis, Nana Owusu-Amponsah, Anai Caparo, Larry Lu, Nancy Li, Jeff VanLooy and Greg Vandeberg. Photo courtesy of Jeff VanLooy.
This past August brought a series of firsts for Nana Yaw Owusu-Amponsah.
The University of North Dakota doctoral student in Earth System Science & Policy climbed a mountain on horseback. Then when the terrain got too steep (for the horse), Owusu-Amponsah kept climbing, hiking while carrying a 40-pound backpack up to an elevation of 12,000 feet. That’s roughly the height of 50 North Dakota State Capitol buildings stacked on top of each other.
It was quite an ascent for someone who lives in pancake-flat Grand Forks and hails from an equally flat town in Ghana.
“I had to drop my bag in the middle of the hike to the first camp site because I was super tired and getting the altitude effect,” said Owusu-Amponsah. “I gradually got used to the terrain and altitude over the next couple of days.”
Then after several more days spent conquering the Wind River Range in western Wyoming, Owusu-Amponsah accomplished another first: he saw a glacier.
It was the Continental Glacier, a sheet of ice that stretches unbroken for more than two miles and straddles the Continental Divide.
“Every single stage [of the trek] had something that I hadn’t seen before,” Owusu-Amponsah said. “But seeing the glacier, it was just ‘Wow.’ Standing on what I study, it blew my mind.”
And Owusu-Amponsah was not alone. His journey to the Continental Glacier this summer was part of a seven-strong expedition led by UND Associate Professor and ESS&P Graduate Program Director Jeffrey VanLooy and Geography Professor and Department Chair Gregory Vandeberg, who have long studied the Wind River Range.
While VanLooy, Vandeberg, Owusu-Amponsah and three other scholars – including ESS&P Ph.D. student Lance DiAngelis and two collaborators from Texas State University — were there to conduct research, Anai Caparo, a master’s student in geography at UND, found herself sleeping in a tent and foregoing showers for 10 days because … well, she loves glaciers. In fact, when Vandeberg suggested she join to help with the expedition, she “almost cried,” Caparo said.
“I am from Peru, where there are glaciers. And I grew up looking at glaciers, seeing them disappear too,” she said.

Caparo and Owusu-Amponsah collect water quality samples at the Wind River. Photo courtesy of Jeff VanLooy.
To learn more about the glacial research expedition, UND Today met with VanLooy and Vandeberg, who explain in the Q&A below what data they collected and what insights it offers.
(The below conversation has been edited for clarity and length.)
UND Today: You have been collaborating on glacial research for some time now and had gone to the glaciers in the Wind River Range before. When was the last time you were on Continental Glacier?
Vandeberg (V): We were there in 2014, collecting data. We were really curious to see what changes have taken place since we were there last. I think it took us about a year to prepare for this latest trip. Jeff was probably more involved with a lot of the day-to-day preparations such as how much food we needed. I was preparing the equipment for the water quality sampling and other data we need to get.
How do you get to the Continental Glacier?
V: The trail going in isn’t maintained. And this year in particular was really, really difficult to get through. Typically, we take horses for the first 10 miles, then walk for another two days with packs on. This year, the outfitter stopped about a mile or a mile-and-a-half from where he normally drops us off because the trail gets really steep, and he didn’t want to lose a horse into the steep canyon.
Even on past trips, you have made a point to bring students with you. Why?
V: Some of them are working on their graduate programs, and this might be part of their research. But for any student who has an interest in environmental sciences, sustainability or water resources, an experience like that can be quite beneficial. We feel that we can really give them a lot of good hands-on experience.
Secondly, we also need their help. I mean, we can’t carry everything ourselves, and we need people to help us ferry all the equipment up there. They’re also helping us to gather data.
What were you hoping to accomplish with the trip this year?
VanLooy (VL): It’s been several years since we were last at Continental Glacier. And in terms of our goals – Number One, we wanted to determine whether it would be a good index glacier and whether access to the glacier is good.
Then, Number Two, when it comes to research, we were looking at things like surface elevation change of the glacier or, in other words, how much it has melted since the last time we measured it. We looked at water quality on the glacier and on the snow surrounding the glacier, and at the stream flow coming off of the glacier and also downstream on the outlet stream before it goes into the Wind River.
But I think the most important thing of our trip that we were focused on this year was stable isotope analysis. And, Greg is the expert on that.

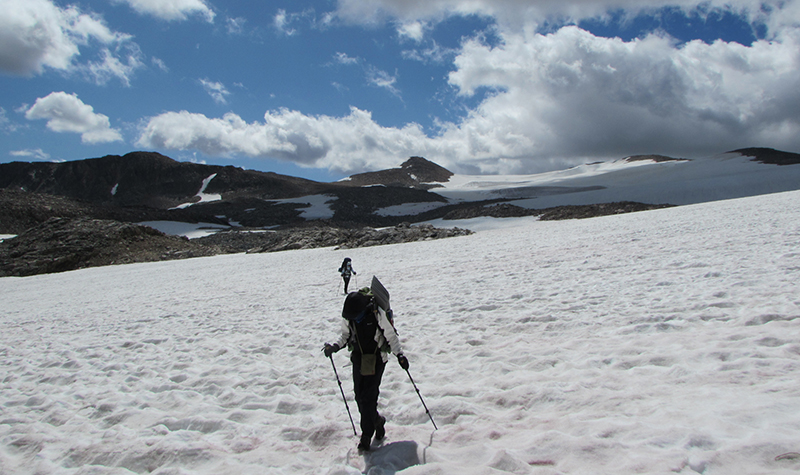
The group had to trek, with backpacks strapped on, across the glacier. Photo courtesy of Jeff VanLooy.
Professor Vandeberg, what is isotope analysis? Is this why you are interested in the glacier as a geographer?
V: I’m a physical geographer, and I really have an interest in river systems. I’ve been associated with water quality studies for many years. But my master’s thesis was on glacial geology. So, looking at the deposits and water flows from glaciers has been a great research experience.
On Continental Glacier, we conducted both oxygen and hydrogen isotope analysis so we can look at the ratios of those different isotopes (or variants of a chemical element) to develop a signature for what’s coming from the glacier melt, what’s coming from snow melt and what’s coming from precipitation.
We also collected measurements across the stream over several times where we gauged how much water is moving past a given point. At the same time, we put in water-level loggers to record the stream depth every five minutes. We correlate this data with the flow measurements in order to have a really nice record for how much water is moving through that system.
Professor VanLooy, what were you focusing on at the glacier?
VL: We continuously look at surface elevation changes to understand how quickly or slowly the glacier is melting. We brought high-accuracy GPS units, and we collect points across the glacier. And if we have enough points, we are able to create a digital elevation model of the glacier, which is essentially an elevation map for that particular year.
This year, we weren’t able to collect quite enough points due to various challenges, but we did get enough points to do comparisons from one year to the next to understand what’s happening at least at those particular point locations.
But, basically, we have elevation data from 1966 from old topographic maps. We have data from 1999 from something called the Shuttle Radar Topography Mission. We have elevation data from 2011, from 2012, and, then, from this year.
Also, our Texas State colleagues who came along had imagery flown, and from that, we can create a digital elevation model. So, we actually have full models of the glacier from 1966, from 1999, to a degree from 2012, and, then, a good one from 2019. We can compare the elevations from those different years to understand what’s going on with the glacier.

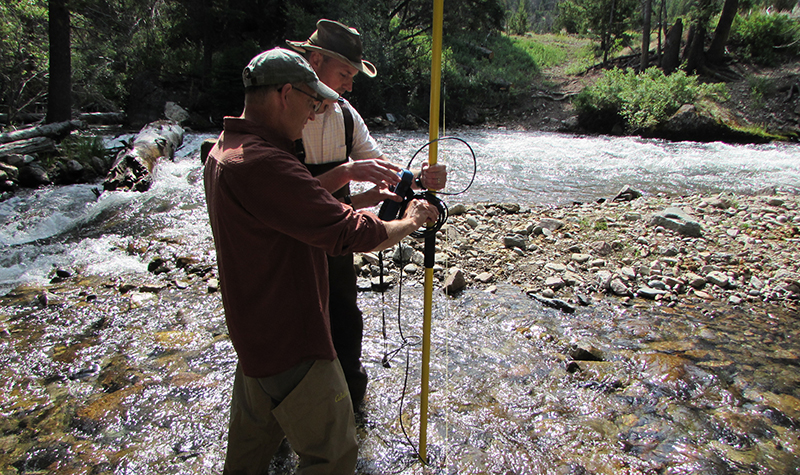
Vandeberg (front) and VanLooy conduct stream flow measurements at lower Torrey Creeek. Photo courtesy of Jeff VanLooy.
So, what is going on?
VL: What I’ve found with my preliminary results to this point is that, from 1966 to 1999, the glacier was melting at a rate of about 0.3 meters – or a foot – per year. So, over that period of 33 years, that compounded to almost 10 meters. From 1999 to 2012, there was quite a bit of melting going on. It looks like during this period, it may have been melting as quickly as 0.6 meters per year. The melting increased quite a bit but there were a number of hot dry years at that time.
Then, from 2012 to 2019, we’ve had a variety of years – we’ve had about three or four hot, dry years and three really wet, cooler years. That has evened things out. We’re back down to 0.28 meters per year of melting.
V: I think one thing that needs to be emphasized about this glacier in particular is that it’s not really shrinking from its edges. It’s melting downward. A lot of studies of glaciers around the world and in the U.S. take aerial photos, and then they look at the extent of the ice and say, ‘Okay, it’s shrinking inwards,’ but they’re not really getting that 3D component that we’re able to get with our study.
I think that kind of information is fairly unique to this study. We’re able to be out in the field and making those measurements, but some of those other studies are what we call remote-sensing studies. They don’t necessarily have data on changes in elevation. It is much easier to measure the change in the area of the glaciers and then use mathematical ratios to say, ‘Well, because it’s this size, this is approximately how much of volume of ice we think is there.’
VL: Thanks for saying that, Greg, because had we never gone to Continental Glacier, and we wanted to study it just by looking at the area, we would have had no clue that it’s thinning from above.
Going back to the term ‘index glacier,’ based on what you have observed and researched, can the Continental Glacier be a good index glacier? And, what does an index glacier even mean?
VL: Another term would be a benchmark glacier. And the U.S. Geological Society has only a small number of benchmark glaciers that they study to understand what changes are going on climatically on them and then extrapolate for other glacial areas.
The Continental Glacier is a part of the Greater Yellowstone Ecosystem, which has no benchmark glacier, largely because it’s incredibly difficult to do this work because it’s so hard to get to them. And there are a lot of restrictions.
V: I think, this year, we realized that the Continental Glacier itself is probably a good index glacier, but access to it is really difficult by horse and walking in.
Will you compile your findings this year in a paper, or do you have other plans?
V: We will give a couple of presentations this spring at the American Association of Geographers meeting, and then compile that into a paper. Plus, Jeff and I have a couple of reports that have to go to the U.S. Forest Service that funded part of this research.


